Truth in Numbers – The Rideshare Business

Rideshare Drivers Earn About $16 Per Hour
How do rideshare drivers determine their “real” income? It’s complicated and this tutorial provides the steps involved in doing that. This is the Lyft version. The data sources are Lyft receipts and personal records.
The Attorney General’s settlement with Uber and Lyft requires a complicated calculation. This is needed to determine a real hourly rate for drivers. Rideshare drivers earn about half of the $33.48 minimum or $16.74 per hour. How do we arrive at that number and where does the other half go? That’s what this tutorial is about. It is intended to help drivers and the public understand the numbers.
The rideshare industry operates on a complex and opaque mathematical system to determine fares and driver payments. We’ll walk through the details. This example is based on two days of Lyft data. Uber will be addressed in another post. Below is the summary report for the time period of the activity. We will work back through the methodology step by step as to how this was arrived at.
$17.47 Net Hourly Rate For Driver

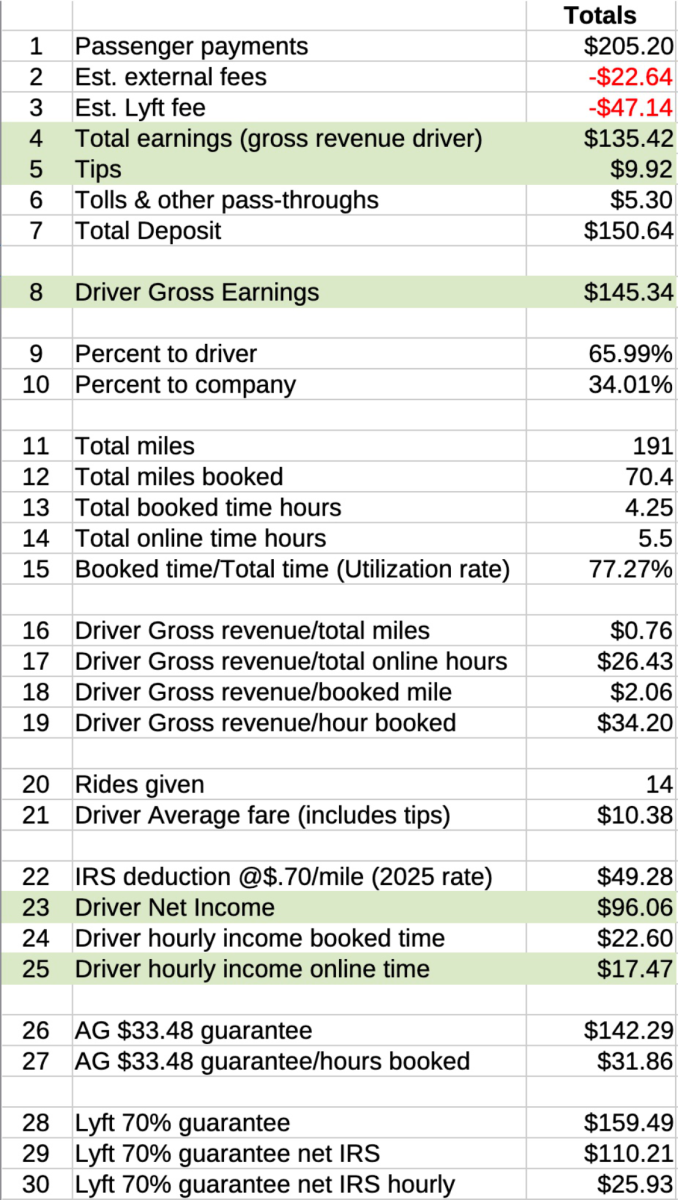
This driver earned $17.85 per hour after expenses as taxable income. We’ll go into more detail on a line by line basis but here is a summary.
- Line 1: Passenger paid $205.20
- Line 4: Driver earned $135.42 after fees.
- Line 5: Driver earned $9.92 in tips.
- Line 8: Driver’s gross earnings were $145.34.
- Line 23: Driver’s net income was $96.06.
- Line 25: Driver’s net hourly income after auto expenses for all hours online was $17.47.
Rideshare drivers do not earn $33.48 per hour.
This tutorial illustrates the process of calculating the real net earnings and taxable income of a Lyft driver. It uses a small sample of Lyft driver data, drawn from ride receipts for 14 rides over a two-day period. In the process we will define terms and calculations. We will start off by showing where the data comes from in the driver’s receipts. We’ll put that data into a spreadsheet for calculations. Lastly we’ll total that data and end with the same table you see in the previous page. In this example the driver earned $17.47 net hourly income. That’s after operating expenses.
Drivers get reports in weekly summary format and also reports on each ride. These are commonly called “receipts”.
Understanding Receipts
Screenshot #1 – Main Report
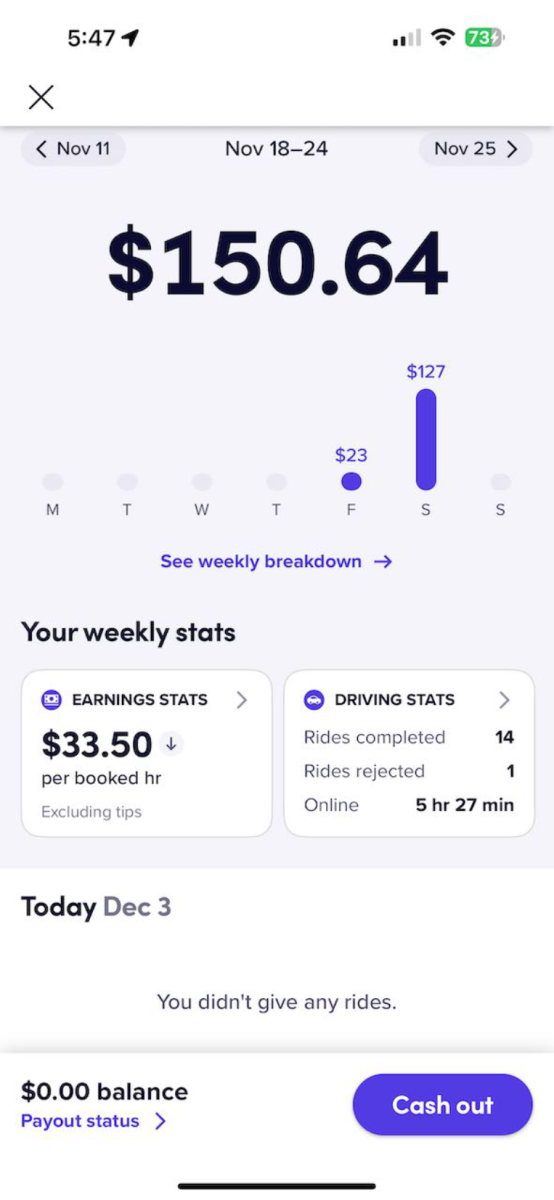
To the left is Screenshot #1 – Main Report, an example of a Lyft “receipt.” Unlike Uber, Lyft provides a summary receipt weekly for all drivers. It details rides completed over a specific period. In this case, the receipt summarizes 14 rides completed over two days. Drivers don’t need to wait until the pay period ends to view this information, as it’s updated continuously. Discussions of earnings should always be supported with actual receipts for.
At the top, you’ll see $150.64—this is the amount that will be deposited into the driver’s bank account. However, this is not the total earnings for the period, as toll reimbursements are included in this figure. It represents the total deposit the driver will receive.*
The Earnings Stats section of the report shows a booked hour rate (or engagement rate) of $33.50. This excludes tips and tolls. The minimum engagement rate required by Massachusetts law is $33.48. We’ll explore how this number is calculated through the data.
Driving Stats show that the driver completed 14 rides and declined or rejected 1. The total online time was 5 hours and 27 minutes. What about engaged time? That information is found on another screen, which we’ll discuss later. It’s worth noting that “booked hour” and “engaged time” are often used interchangeably.
All the numbers in this report are based on receipts. While there are too many individual receipts to include here, they are available for review upon request.
Finally, let’s examine the numbers from a single receipt as a starting point.
*Drivers also have the option to “cash out” anytime using the button at the bottom of the app. Both rideshare platforms offer programs to support drivers without a car or immediate cash, functioning like an ATM when needed.
Lyft Receipt for 1 Ride – Row #17
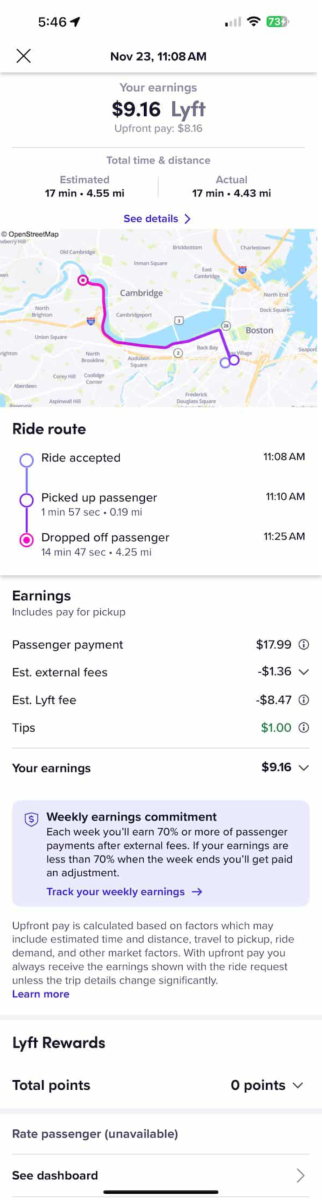
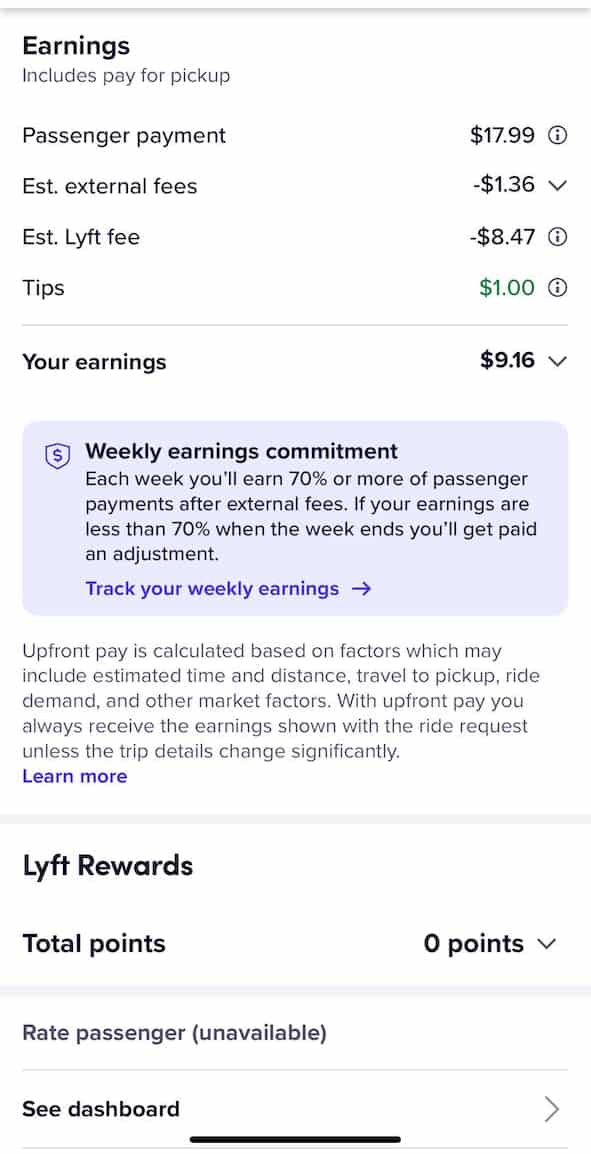
To the left is Screenshot #2, a full receipt for a single Lyft ride. This example will help explain how to interpret rideshare data. Refer to row #17 in the table; receipts are available for every row in the spreadsheet on page 7.
The ride request was accepted at 11:08 AM, marking the start of engaged time—but not yet paid time. The passenger was picked up at 11:10 AM, at which point payment begins. The ride ended when the passenger was dropped off at 11:25 AM. This quick pickup suggests high demand in that area at that time.
This ride reveals some striking numbers. The passenger paid $17.99, while the driver received $8.16—less than half of the fare. Rideshare companies historically took 20% of fares, but here, Lyft is taking 55%. Additionally, a $1.00 tip was added after the ride.
Exact pickup and drop-off addresses are no longer provided. But, the map suggests the pickup was on Berkeley Street in the South End. The route followed Storrow Drive to Cambridge, covering a distance of 4.43 miles.
One standout figure is the Estimated Lyft Fee, which is a hefty $8.47. What does this fee include?
Let’s break down these fees one by one to better understand the distribution of costs.
Estimated External Fees
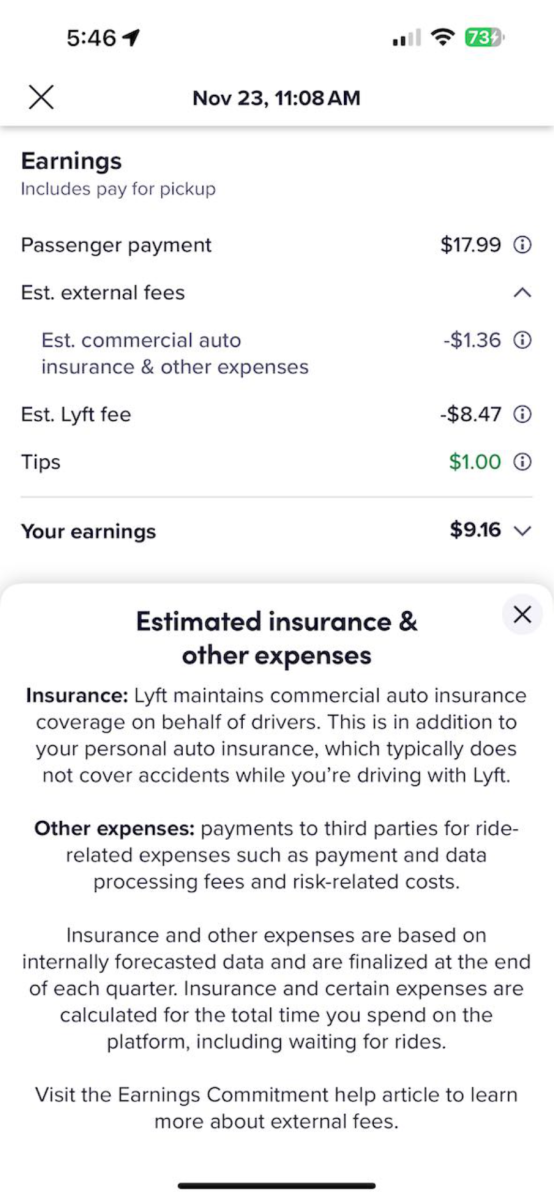
To the left is Screenshot #3, which highlights the “Estimated external fees” line item. This is described as “Estimated commercial auto insurance & other expenses.” A deeper look into the details window provides additional information.
Insurance: Lyft states this covers drivers and passengers while en route to a pickup and during the ride itself. It’s true that a driver’s personal auto insurance does not extend to rideshare activities, making this coverage essential.
Other expenses: This includes payments to third parties for various services, though specifics are not detailed.
Lyft mentions a notable point. Insurance costs are based on “the total time you spend on the platform, including waiting for rides.” In this example, the external fee is only $1.36.
Drivers are also required by law to keep “gap insurance” through their personal insurance providers. This covers them while they are online and waiting for ride requests. Nevertheless, this raises an important question: how does gap insurance differ from Lyft’s platform-based coverage for the same period? If both are required, does this result in a double payment for the same type of insurance?
Rideshare insurance for drivers consists of three parts:
- Personal Auto Insurance: Required for all drivers. Purchased by the driver.
- Lyft Insurance: Covers the driver from the moment they accept a ride request until the passenger is dropped off. Provided by Lyft.
- Gap Insurance: Covers the driver while they are online and waiting for ride requests. Purchased by the driver. And also provided by Lyft?
This layered system adds complexity, and the overlap between gap insurance and Lyft’s own coverage warrants further examination.
Estimated Lyft Fee
To the left is Screenshot #4, which outlines earnings and deductions. For this specific ride, a Lyft fee of $8.47 is shown. The trip covered a distance of 4.43 miles, taking 17 minutes, from Berkeley Street westward along Storrow Drive to Cambridge. No tolls were involved. So, what could justify this fee? Is it consistent across all passengers? Why don’t similar rides incur identical fees? Lyft provides an explanation of their fee structure at the bottom of the graphic.
The first section of the explanation describes routine business expenses. But why are these being highlighted? Managing such costs is inherently part of Lyft’s operations and responsibilities as a business.
The second section explains how this figure could occasionally be positive, reflecting bonus payments. Yet, these bonuses are highly variable and change often.
The critical question remains: where is Lyft’s profit within this breakdown of revenue and expenses? While the specifics may not be fully transparent, it’s clear that record profits are being made. The profit margin is embedded somewhere in these calculations.
Weekly Earnings Commitment
In the lavender-shaded box to the left, Lyft outlines their “Weekly Earnings Commitment.” This guarantees drivers 70% of passenger payments after external fees. This policy has been in place for several months. It predates the Massachusetts Attorney General’s mandate of a minimum of $33.48 per engaged hour.
An important question arises: what happens if the $33.48 minimum ends up being less than 70% of passenger payments? Drivers have not reported any conflicts when asked. Further research could help clarify how these two guarantees interact in practice.
Driving Stats Receipt
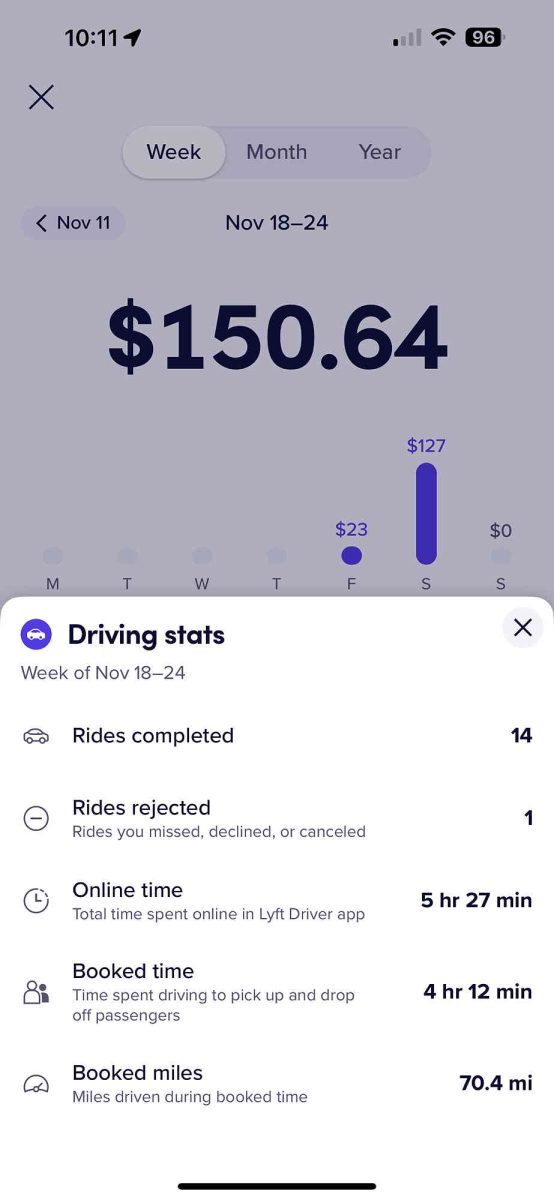
To the left is Screenshot #5, another screen accessible from the main report window. This screen provides key metrics, including rides completed, rides rejected, online time, booked time, and booked miles.
Booked time refers to the same metric as engaged time. To calculate the hourly rate for booked time, subtract tips and tolls from total earnings. Then, divide the result by booked time. This calculation is detailed below as Engaged Time.
Drivers often measure their income in Gross Revenue Per Hour Online. This number is how drivers compare their performance with one another. Drivers do not use annual earnings. Drivers have all manner of working routines from full time down to a few hours a month. As such hourly rates are the only way to compare earnings performance.
A related term often discussed is utilization rate, which measures the percentage of online time spent on booked rides. It’s calculated as the ratio of booked time to online time. In this case, the utilization rate is 4.25 hours of booked time divided by 5.5 hours of online time, resulting in 77%.
Booked miles are also displayed, though drivers typically focus on total miles driven, which they track independently for tax purposes.
Finally, the ratio of gross revenue per mile is a key indicator of performance, efficiency, and profitability. This metric provides a comprehensive measure of a driver’s overall effectiveness in balancing time, distance, and earnings.
Data List Part 1 – Time
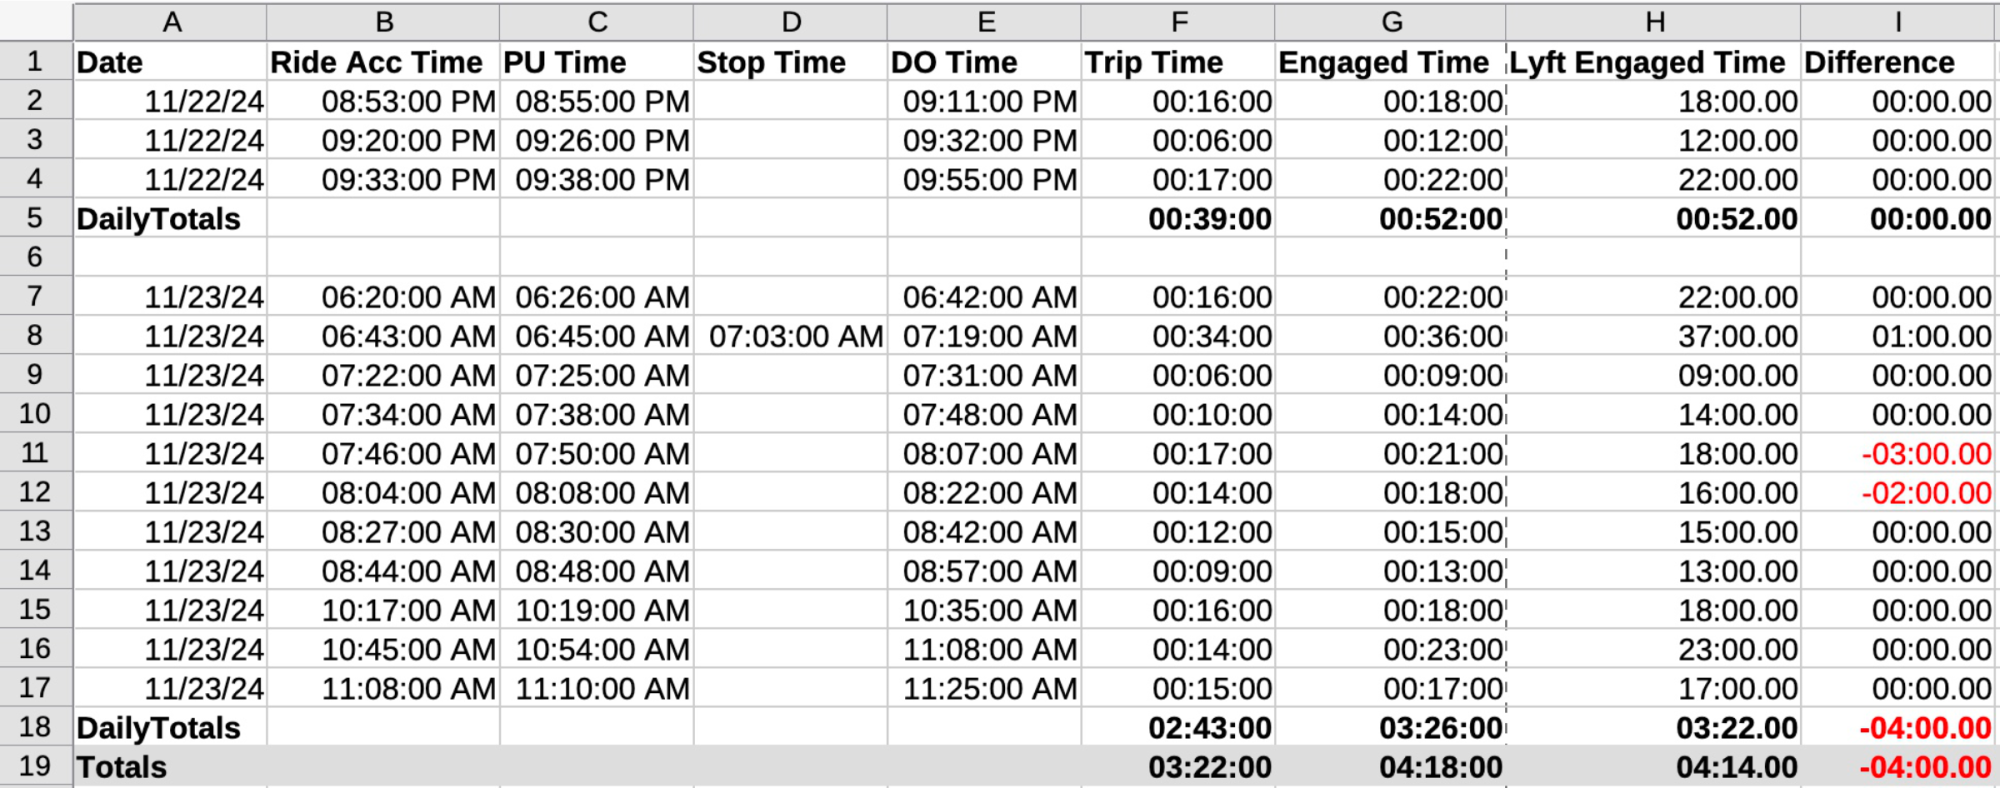
Column Headings Defined
- Date: The date the ride service was performed.
- Ride Acc Time: The time the ride was accepted. This marks the start of engagement time.
- PU Time: Pickup time, when the passenger was picked up and the ride officially began.
- Stop Time: The time a stop occurred, if applicable. Passengers ask for stops for various reasons during a ride.
- DO time: Drop-off time, when the passenger was dropped off and the ride ended.
- Trip Time: The duration from the start of the ride (pickup) to its conclusion (drop-off). This is the time the passenger spent in the vehicle. It does not include en route time, which is part of engagement time.
- Engaged Time: The total time from when the ride was accepted. This includes en route time to the pickup. It continues until the passenger is dropped off. It is calculated as the difference between DO Time (column E) and Ride Acc Time (column B).
- Lyft Engaged Time: The engagement time reported by Lyft. This figure does not always match the calculated Engaged Time and originates from Lyft’s system. This discrepancy will be discussed further.
- Difference: The variance between the calculated Engaged Time and the Lyft-reported Engaged Time.
Notes
Row 8: There is a 1-minute positive discrepancy in the Lyft-reported Engaged Time. The source of this discrepancy is unclear. It may result from Lyft rounding fractional times up to the next full minute.
When demand is high, drivers will get the next request before they drop off the current passenger. There’s 2 such occurrences in the above table.
Rows 10 and 11: The passenger in row 10 was dropped off at 7:48 AM. The next ride in row 11 was accepted at 7:46 AM. This resulted in a 2-minute overlap.
Rows 11 and 12: The passenger in row 11 was dropped off at 8:07 AM. The next ride in row 12 was accepted at 8:04 AM. This created a 3-minute overlap.
These overlaps result in negative values (highlighted in red) in the Difference column.
Data List Part 2 – Lyft Estimates & Actual Miles
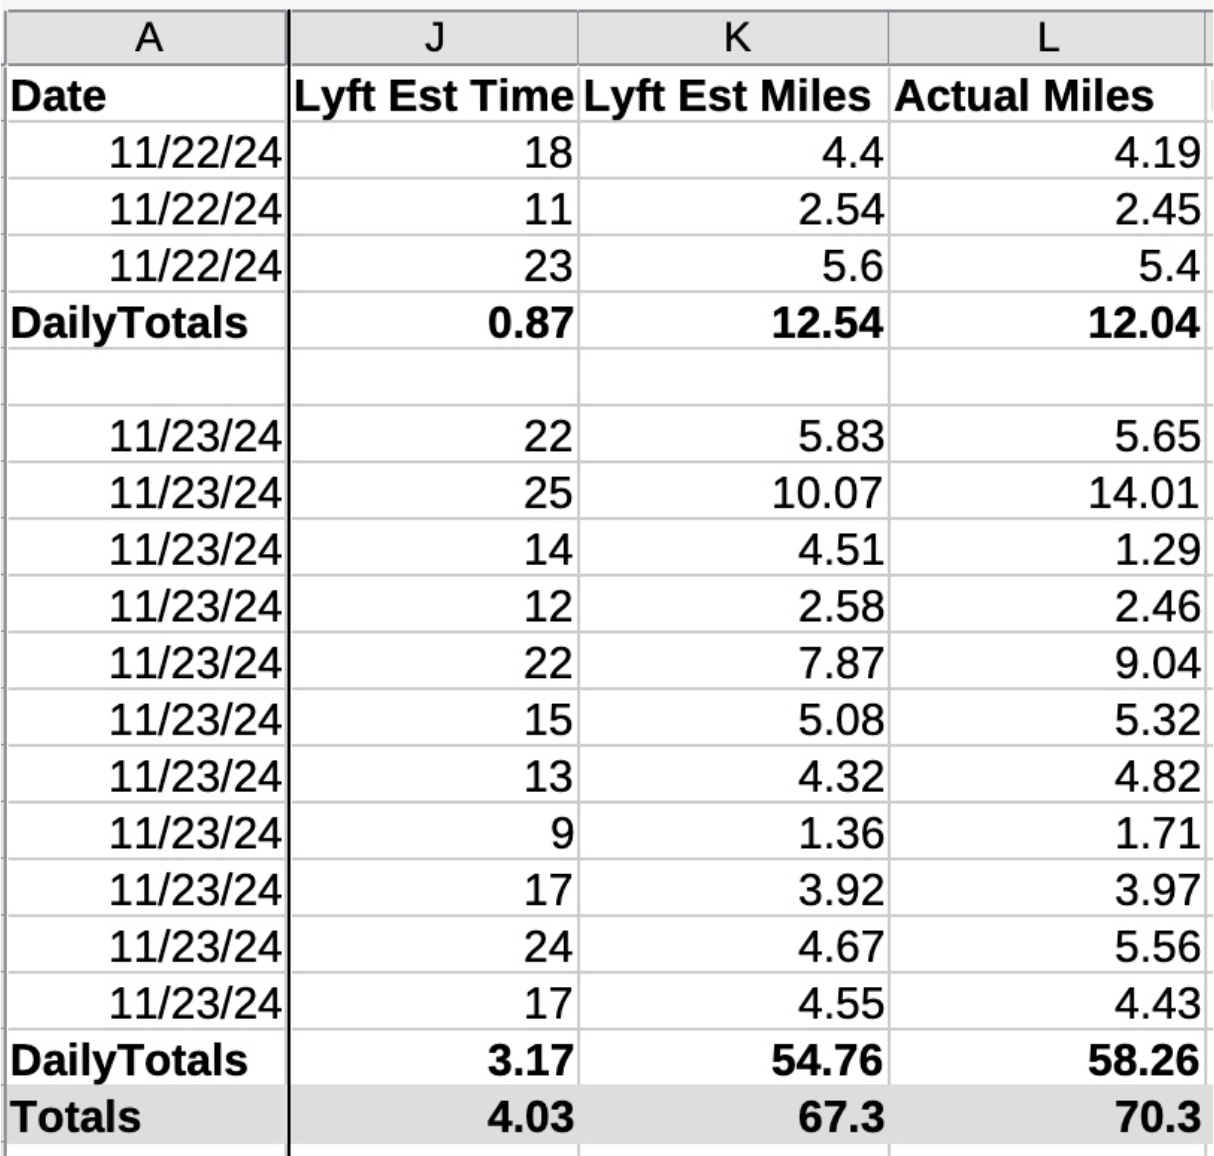
Column Headings Defined
- Lyft Estimated Time: The estimated time Lyft uses to calculate the “Upfront Fare.”
- Lyft Estimated Miles: The estimated distance Lyft uses to calculate the “Upfront Fare.”
- Actual Miles: The actual distance driven during the ride.
Notes
Lyft generally does a good job estimating time and distance. However, during heavy traffic, congestion, road closures, or accidents, these estimates can be significantly off. Lyft may adjust fares to compensate drivers in such cases. However, the adjustments are sometimes insufficient. As a result, drivers need to file appeals.
The exact rates for time and distance remain a mystery. Many drivers suspect that these rates are intentionally modified on a ride by ride basis. They believe adjustments are made to keep total driver earnings close to the state-mandated minimum of $33.48 per engaged hour. In other words, the customer pays the same amount. Lyft may retain a higher percentage of the Upfront Fare. They pay the driver just enough to ensure the hourly rate stays just above the $33.48 minimum required by law. The classic promise of America where the harder you work the more you benefit has been made invalid.
Data List Part 3 – Payments
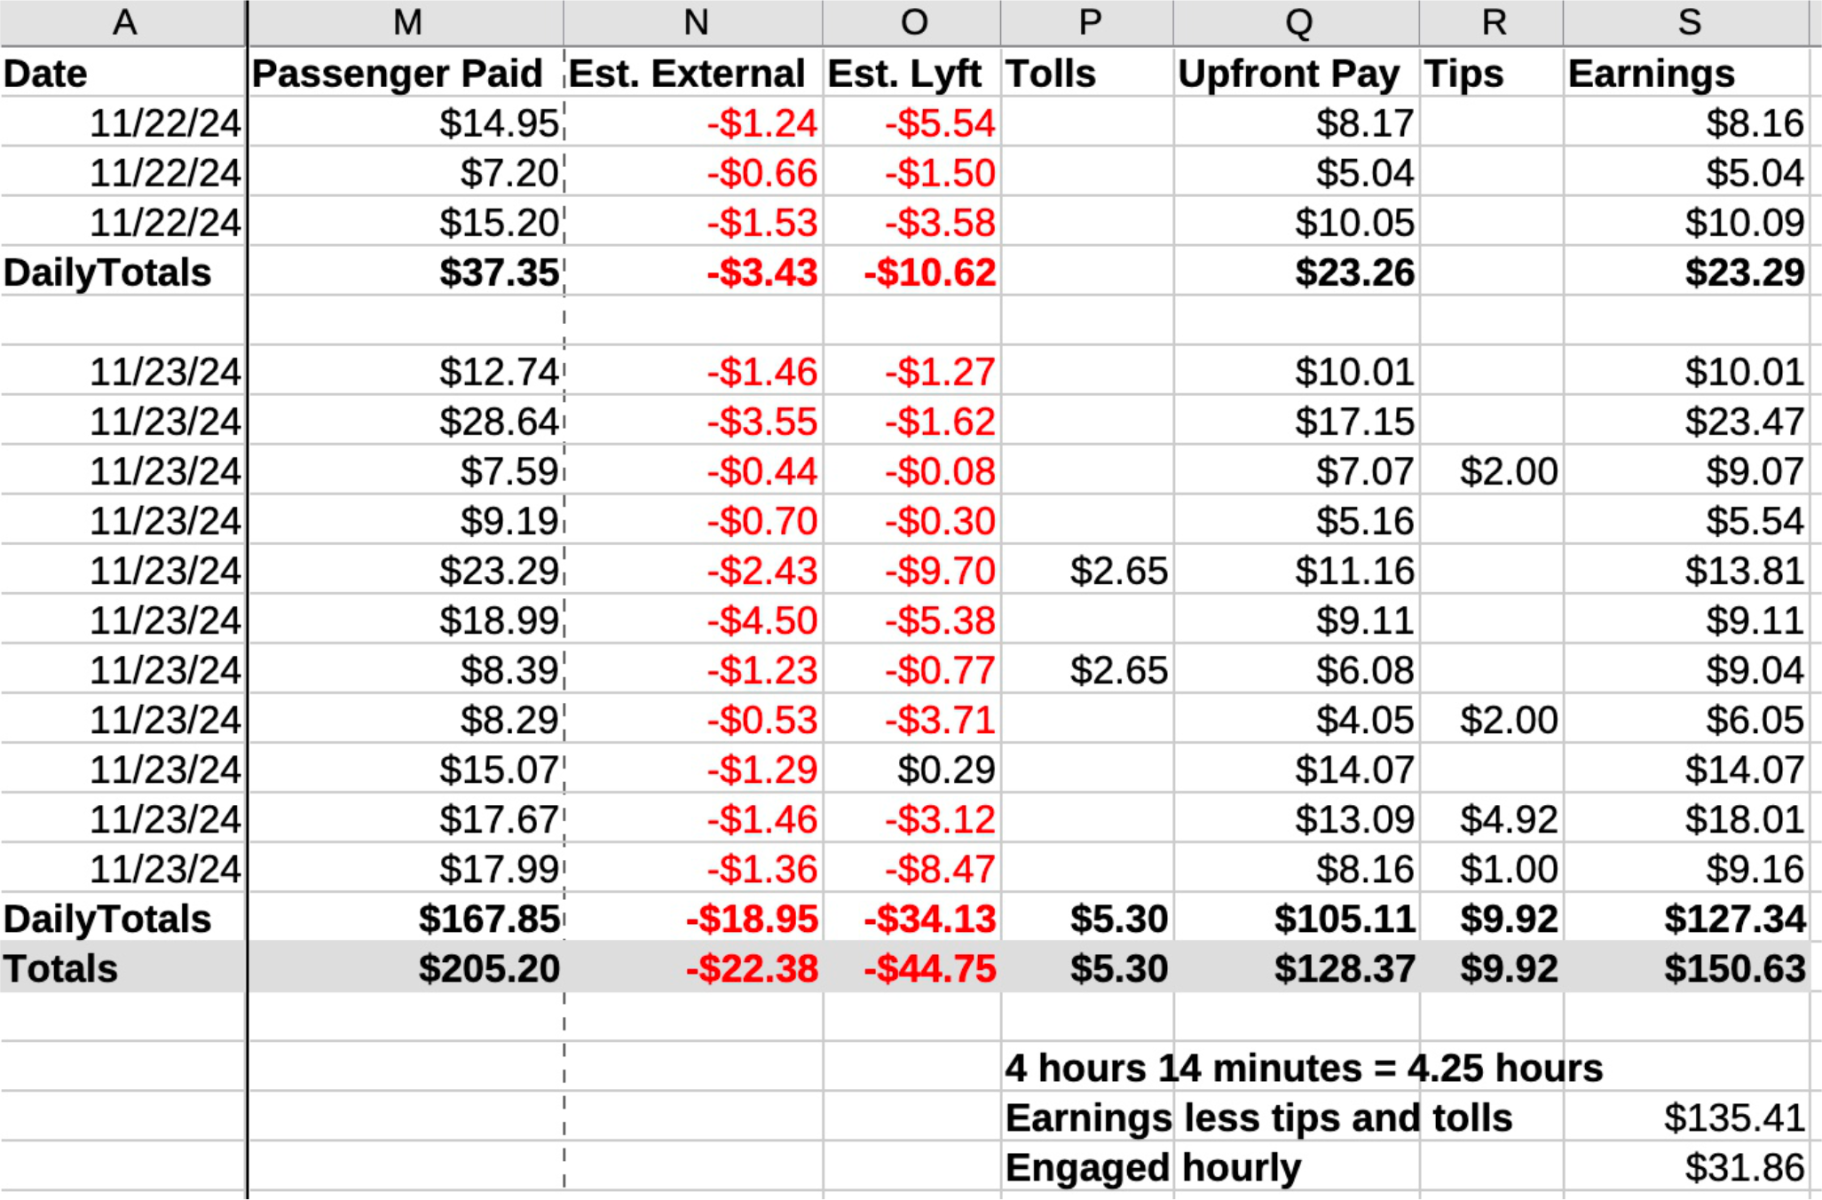
Column Headings Defined
- Passenger Paid: The total amount Lyft reports as paid by the passenger for the ride.
- Est. External: Represents “Estimated External Fees,” which Lyft attributes to “estimated commercial auto insurance and other expenses.” Further details require a separate technical note.
- Est. Lyft: The “Estimated Lyft Fees,” described as costs for maintaining the platform, investing in ridership growth, and improving the app. Under certain circumstances, this figure may appear as a positive number. Additional details follow.
- Tolls: Drivers pay tolls as they occur. The passenger is charged for the tolls and the driver is reimbursed.
- Upfront Pay: The amount initially calculated for the driver’s payment. The payment may change if the ride deviates from the original estimate. Factors such as road closures or traffic can cause these deviations. Drivers can also request adjustments.
- Tips: Any tips provided to the driver by the passenger.
- Earnings: This is not “earnings”. Tolls are included. Tolls are an expense. This number “Earnings” is what will be deposited to the driver’s bank account. It includes the reimbursements for tolls.
Hourly Earnings Calculations for Engaged Time
The Engaged Hourly Rate or Booked Time Rate is determined by subtracting Tips and Tolls from the Total Earnings. This result is then divided by the Engaged or Booked Time. In this case it works out to be $31.86 which is less than the $33.48 required.
Putting It All Together
We have arrived at the conclusion. We gathered the data from it’s sources, put it into a spreadsheet, and totaled it up by category. Here we finalize our work in a report with line by line annotation.

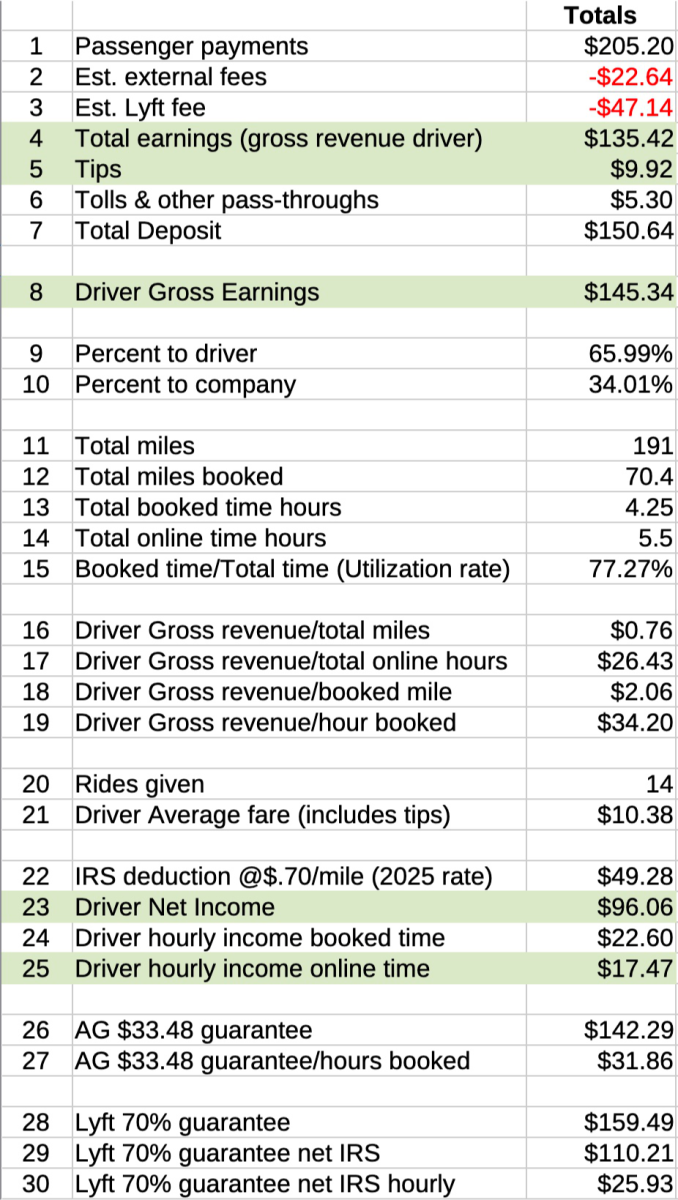
- Passenger payments: from Lyft receipt. This is what passengers paid to Lyft. Details with screenshot below.
2. Est. external fees: from Lyft receipt. This is shown as commercial auto insurance & “other expenses”.
3. Est. Lyft fee: from Lyft receipt. This needs further explanation as it can either be a negative or positive number.
4. Total earnings: from Lyft receipt at top and in green at bottom. This is the sum of the above 3 items.
5. Tips: from Lyft receipt.
6. Tolls & other pass-throughs: from Lyft receipt. What are the “other pass-throughs”.
7. Total Deposit: this is what will be deposited to the driver’s bank account. It includes expenses paid for and incurred by the Lyft platform and is not all earnings.
8. Driver Gross Earnings: The most important number to the driver. Tips added to Total earnings. This is what the driver pockets and lives off.
9. Percent to driver: This is the percentage of total passenger payments that the driver receives. It can be more than 100% depending on bonuses and incentives.
10. Percent to company: 100% – Percent to driver. Again, this can yield a negative number to the company depending on bonuses provided by the company.
11. Total miles: from driver records.
12. Total miles booked: from Lyft receipt.
13. Total booked time hours: from Lyft receipt. The total number of hours booked. This number is the “engaged time” used to calculate whether the driver meets the $33.48 minimum as required by a recent lawsuit settlement.
14. Total online time hours: The total time the driver was online whether engaged or not.
15. Booked time/Total time: the percentage of total time engaged. This is also referred to as the “utilization rate”.
16. Driver Gross Revenue/total miles: this ratio is determined by the Driver Gross Earnings by total miles driven. This is an important number. Urban drivers tend to have a higher ratio of dollars per mile than suburban drivers. A high ratio means you are covering your miles with a paying customer.
17. Driver Gross Revenue/total online hours: the real dollar per hour gross revenue for total hours worked.
18. Driver Gross Revenue/booked mile: the real dollar revenue per booked mile. Does not include all miles for the shift as not all miles are booked.
19. Driver Gross Revenue/hour booked: the real dollar revenue per hour booked/engaged. This is what is compared to the Attorney General’s settlement minimum of $33.48 per hour.
20. Rides given: from Lyft receipt. Total rides given.
21. Driver Average Fare: a simple average calculated by dividing the total number of rides into the Real Gross Earnings.
22. IRS deduction @$.70 per mile: This is the 2025 IRS auto expense deduction for mileage. This number includes all auto expenses. It is used as a simple alternative to itemized deductions. It is applied to Total Miles.
23. Driver Net Income: Calculated by subtracting the IRS mileage deduction from the Real Gross Earnings.
24. Driver hourly income booked time: the Driver Net Income divided by Total booked time hours.
25. Driver hourly income online time: the Driver Net Income divided by Total online time hours.
26. AG $33.48 Guarantee: Attorney general’s settlement guarantee of $32.50/hour. Calculated from chart data.
27. AG $33.48 guarantee/hours booked: Calculated by dividing the hours booked into the AG’s Guarantee.
28. Lyft 70% Guarantee: Lyft guarantees that the driver will always earn at least 70% of the passenger’s payment. This amount is calculated after subtracting external fees.
29. Lyft 70% Guarantee net IRS: Calculated by subtracting the IRS mileage deduction from the Lyft 70% Guarantee.
30. Lyft 70% Guarantee net IRS hourly: Divide the Lyft 70% Guarantee Net IRS by the Total Online Time Hours to calculate this. If the Total Online Time Hours are not available use the Total Booked Time Hours.
Summary & Conclusion
We’re all connected in this ecosystem—consumers, drivers, third parties, and communities. When a business operates within a community, it has a responsibility to contribute positively to the local economy. It should offer fair pay and reasonable prices. Without this balance, problems inevitably arise. Underpaid employees will sometimes rely on food stamps and other public assistance to make ends meet. This is a consequence of unfair business practices. To build a sustainable relationship, businesses must integrate into the community by supporting drivers, passengers, and the local economy.